Investment Classes | What is OptionsWest?

|
The OptionsWest Trading Service manages three trading accounts as examples for our clients. The EquiFund, the Blue Sky Account and the Active Trader Account. Each trade and position move in all three accounts is shared via timely email alerts, daily email reports, and access to the members area of the website. The members area maintains a daily record of all three accounts and also presents a variety of stock selection reports and tools. All the email alerts, stock reports and tools are available as part of the monthly subscription. The information is available 24/7 in the members area of the website with your login and password. Members who have taken the Weekend Course or the California eight-class course receive 12 months of the trading service as part of their tuition. |

|
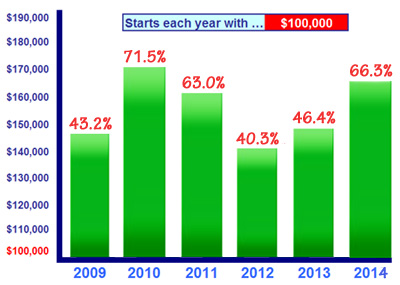
The EquiFund is an investment account that we trade as example to our clients showing the OptionsWest style covered call trading strategy. Each year this account starts with $100,000 and works to achieve its objective of a 40% to 50% ROI. The EquiFund has consistently reached this objective each year since its inception in 2009. The trading approach in this account exclusively trades our unique covered call strategy that is taught in our courses and seminars. The members area of our website maintains a daily record of the detailed trades of this account and also provides a Daily Covered Call Listing report for finding good trade candidates. |
| |

|
The Blue Sky account is a stock trading account with a very simple strategy and approach. In this acount we only trade when the market has experienced a major or significant pull back. Much of the year we are in a full cash position waiting for an obvious opportunity. We have found this approach, only trading when the market is offering an obvious buy point, to be a very simple yet lucrative strategem. The stocks we select to trade in this account are chosen first from their technical aspect and secondly for their fundamental characteristics. Every management move in this account is shared via timely email alerts and daily reports. Our annual ROI objective is 50%. |
| |
|
The Active Trader account is also a stock, as well as an options trading account that utilizes four specific trading strategies. In this account we practice 1) Volatility Squeeze trades 2) Momentum Trades, 3) Initial IPO trades, and 4) Secondary IPO trades. All of the these strategies are taught in our courses and seminars and can be followed through the Trading Service offerings. Again, each trade and management move is shared and explained through timely email alerts and daily trading reports, as well as available through reports and tools available on the members area of the website. Memebers of OptionsWest Trading Service have complete access to all this information 24/7 and are welcome to email or call with questions. |

| |
The reports and support tools supplied by the Optionswest team were initially created to support our own trading and investing accounts. They include all the information we always felt we needed to trade successfully. Since much of this information was not available in the formats we felt were required for timely and accurate investing, we ended up creating the reports and tools oursleves and now we share them with the Trader Service members. We could not and would not trade without this information. |
| |

|
The OptionsWest Trading Service includes the Daily Rocket, an email report sent each market trading day recapping the status and management moves made in the the EquiFund, the Blue Sky account, and the Active Trader account. It also includes comments on the market environment and the status of individual trading positions. This report as well as all the reports and tools available in the members area of the website are the same reports we use to select and manage our own trading accounts. This approach has been a great learning tool for our clients. |
| |

|
The Sweet List is a list of stocks that we have culled from the 500 stocks on our watch list as current trading possibilities. These are stocks that we feel are viable trade candidates right now. These stocks are usually in a sector that is working and are under accumulation by the big money funds. You will find that stocks in the Blue Sky Account and the Actve Trader Account come from this list, which we try and publish about once a week. We also list IPO's that are in the wings. |
| |

|
The Volatility Squeeze report is a listing of volatility squeeze trades that we have found through our weekly research. Volatility Squeezes are a strategy that recognizes a specific Bollinger Band opportunity that we have found has a very high success ratio. You can learn about Volatility Squeezes in our investment courses or read John Bollinger's book on his approach to investing. We list these possible V-Squeeze trades in three stages, "Still on the tree", stocks we are watching, "Ripe & Juicy", V-Squeeze trades that are working, and "Sweet OJ", as Volatility Squeezes that have worked well and are now mature. |
| |

|
The Momentum "Charts that are working" report is a listing of stocks by sector where the charts show they are currently being accumulated by the big money funds. The stocks listed have charts that show good momentum and are ripe for finding a good entry point. This report also gives us an idea which sectors are currently in favor and which ones are out of favor. Sectors that are working will have a good number of stocks listed and sectors that are not working will usually have no stocks with good current chart action. |
| |

|
The "Sectos that are Working" report is a terrific graphical picture of the industry groups that are currently in favor and being bought by the smart money in the market. The report is weighted with the best industry sectors at the top and the less favorable industries at the bottom. The "sectors that are Not working" are the current dogs of the market and should clearly indicate what sectors to avoid in the current trading environment. |
| |
|
The OptionsWest Oscillator is a graph showing the overbought and oversold condition of the market as a whole. It is most reliable at extremes and gives us a broad picture of what level of cash there is available in the market to buy stocks. When the indicator is above 6 we have reached an overbought status and most money is already in the market. When the indicator drops to negative 5 or 6 we have an oversold market level and liquidity is considered relatively high. This information gives us an idea of the current risk profile we should applyto our trades. |
| |

|
The OptionsWest Current Market Report is a weekly statement of our read on the current status of the SPX and where it is headed or what may affect it in the near future. We also point out the current world economic forces at play that may affect the marke tin the short term. The report also shows a listing of industry sectors that are presently working and also industry groups to avoid. It lists Volatility Squeeze trades that we are thinking of trading and IPO's that we are watching for launch dates. |
| |

|
The OptionsWest "
Daily Covered Call Lists"
are available each day about 9:00 am PST. They show the current useable month trade possibilities available for those trading the OptionsWest Covered call strategy. This is the list we produce and use to trade the EquiFund. The list shows trades that have a positive percentage return, although determination of the safety and acceptable risk of each trade is part of learning the unique OptionsWest covered call strategy. This is a raw list and choosing successful covered call trades from this list is a skill that is learned from experience. Our eight class course and weekend seminars teach this skill set. |
|
These reports and tools support following and learning the techniques that we use to trade the equiFund strategy. |
|
 |
 |
These timely daily email alerts follow every step we make and report every management move for each trade in the equiFund. Alerts are usually sent within 5-10 minutes of a position move. |
|
 |
This daily sheet lists the possible trades that are available each day and is the basic list we use in selecting new monthly positions for the equiFund. |
|
 |
This detailed log chronicles every decision and step taken in every management move for each trade in the equiFund. This log is up-dated within 30 minutes of each move including the initial purchase. |
|
 |
This graph shows the over-bought or over-sold condition of the general market. It is a very helpful gage on what level of risk to take in placing trades within the scope of a specific account. |
| These reports and tools support following our approach to trading both the ActiveTrading Account & the Blue Sky Account. |
|
|
 |
This weekly report lists all the Volatility Squeezes that we are watching. V-Squeeze trades are a consistently successful market trading strategy and we use this list to place active trades. |
|
 |
This report shows Volatility Squeezes that are working well and that we are trading in our own accounts. We also provide details of our entry and exit decisions with these squeeze positions. |
|
 |
This weekly report is an overall view of the market demographics and sentiment. It also shares our thoughts on where we think the market is headed in the short term and why. |
|
 |
We choose a single chart each week that represents a stock that is working well. This is a stock that is obviously under accumulation by the institutions and is an investment opportunity. |
|
 |
Institutional money moves from sector to sector as market forces dictate. Following the money is a good way to have consistently profitable trades.This weekly report lists the sectors that are working and sectors that are not working. |
|
 |
This weekly report lists stocks that have charts that are technically in a sweet spot. Technical traders love a good looking chart, as they know it will make them money. We trade from these reports. |
|
All these reports and tools are available as a monthly subscription. The information is available 24/7 in the members area of the website with your login and password. Members who have taken the Weekend Course or the California eight-class course receive 12 months of the e-Advantage service as part of their tuition as well as admission to our monthly on-line SuperSession trader forum meetings. |

|
The standard price for this service is $100.00 per month with a discount available for those who keep a current credit card on file. The first month is considered a FREE trial and you may of course cancel at anytime. |
|

"I am very pleased to be making comfortable and profitable trades without much stress.
It is truly a wonderful system you have built. Thank you once again"... Bryan Canfield, Former Stock Broker